Project: Rabbit embryo atlas
In this project, I curated and analysed a large molecular atlas of early rabbit development. I applied a variety of data science skills in the context of a 4-year collaborative research study, where the initial goals and scientific questions were very ambiguous.
The project involved working with large, complex biological datasets, applying mathematical and statistical knowledge, problem solving, programming in R and Python, presenting data in clear and visually appealing ways, and collaborating with cross-functional teams.
The data analysis performed as part of this project helped to uncover new insights into early rabbit development (Ton et al. 2023). Our molecular comparisons between rabbit and mouse embryos have significant implications for how we extrapolate beyond the mouse to understand human development and develop safe pharmaceuticals. This work has since been presented at international conferences, featured in online articles (Ortolano 2023), and has been published in Nature Cell Biology (Ton et al. 2023), a high-impact academic journal.
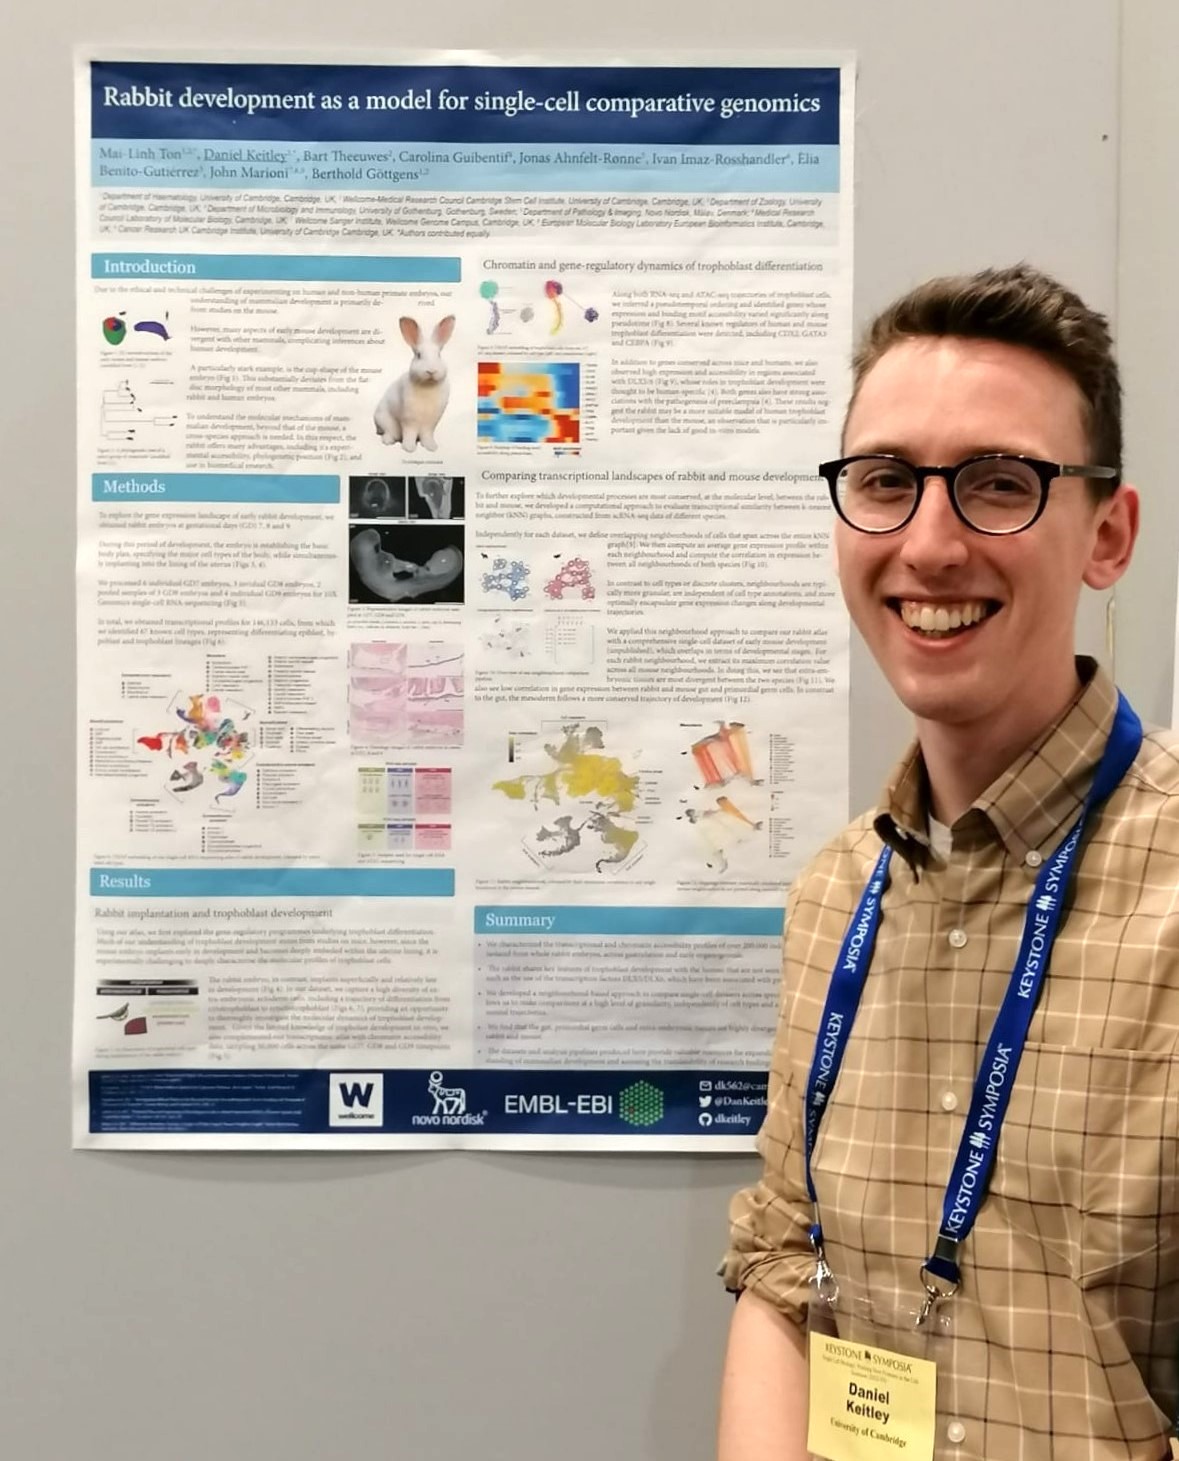
Figure 1: Presenting our rabbit work at the Keystone Symposia Single-Cell Biology conference in Florence, Italy.
Figure Design
I really enjoy making data visualisations and communicating complex ideas clearly, in visually pleasing ways. Below is a small collage of figures from various research projects.
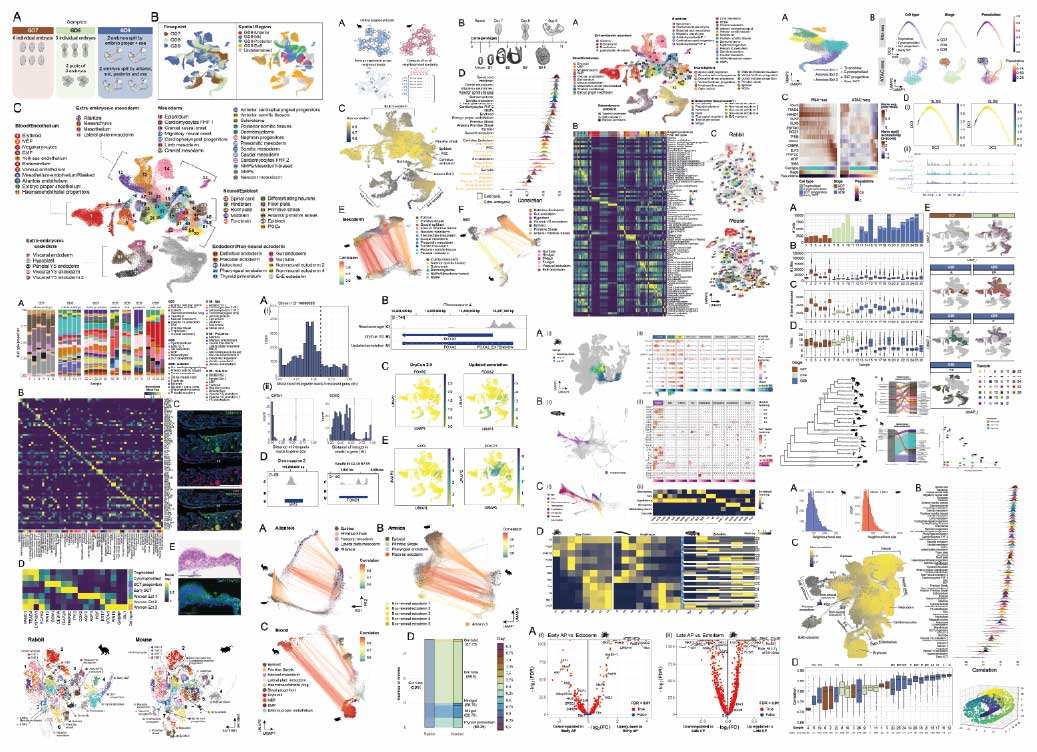
Technologies used: R, Python, Adobe Illustrator, numpy, pandas, ggplot, seaborn, matplotlib.
Graphic Design
Using Adobe Illustrator, I designed the graphic selected for front cover of the July 2023 issue of Nature Cell Biology 1. The graphic depicts our approach to compare gene expression across k-nearest neighbour (kNN) graphs, constructed from single-cell RNA-seq data of the rabbit (left) and mouse (right) embryo (Ton et al. 2023). Lines between each species represent mappings between cell neighbourhoods with similar gene expression profiles. The low-poly graphics were based on brightfield microscopy images of a day 9 rabbit embryo and a day 9.5 mouse embryo.
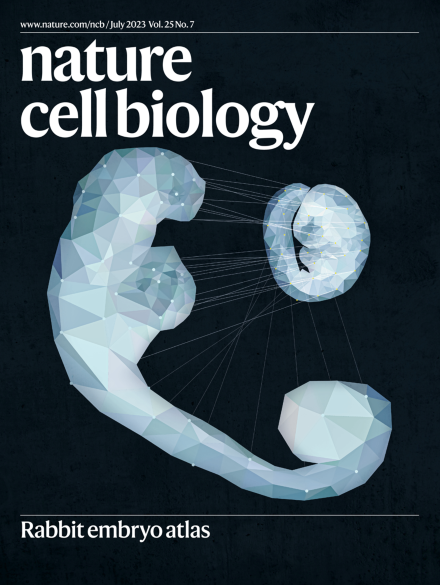
Figure 2: Nature Cell Biology.Volume 25 Issue 7, July 2023. Image: Daniel Keitley. Cover Design: Lauren Heslop.
Technologies used: Adobe Illustrator.
R Shiny
Using R shiny, I created an online portal to allow others in the scientific community to access biological images and single-cell RNA-sequencing data generated from the rabbit embryo.
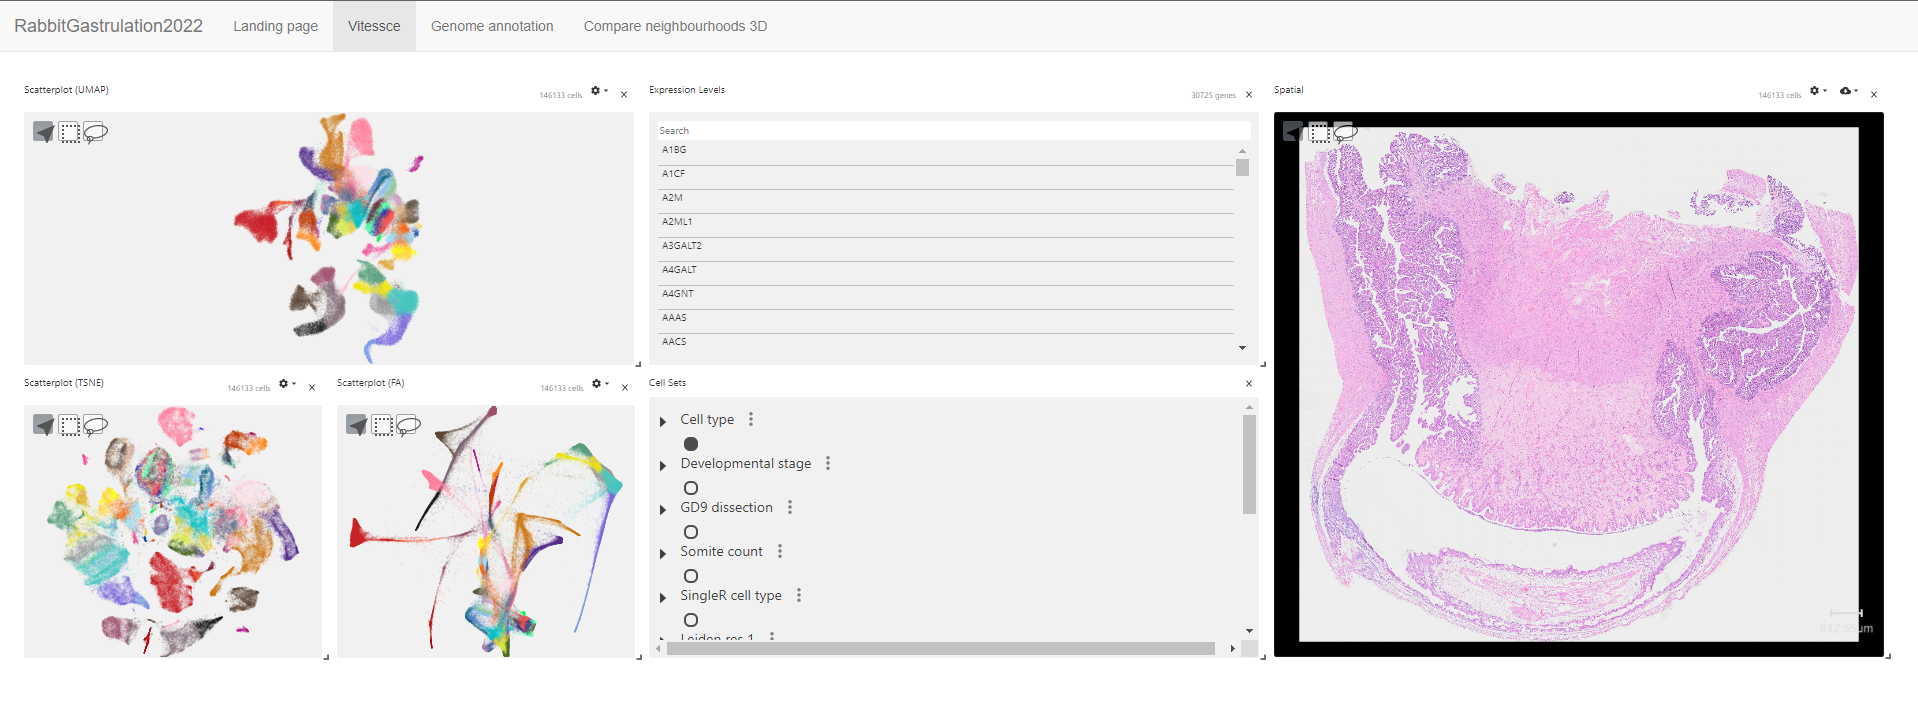
Figure 3: Interactive web portal allowing others in the scientific community to explore genomics and imaging data from the rabbit embryo. Accessible at https://crukci.shinyapps.io/scrabbit-shiny/.
To create interactive views of the genomics and imaging data, I leveraged Vitessce, a JavaScript framework, which is very flexible, fast and well-documented. I created data views which displayed the most relevant information, such as the biological sample of each cell and used consistent colours with original research publication. I also integrated genome browser tracks using IGV.js (Robinson et al. 2022).
To make use of the existing infrastructure/shiny server available, I incorporated the Vitessce visualisations into an R shiny app and deployed it using https://www.shinyapps.io/.
The Shiny app can be accessed at https://crukci.shinyapps.io/scrabbit-shiny/.
The Github repo can be found at https://github.com/dkeitley/scrabbit-shiny.
Technologies used: R, JavaScript, R shiny.
SQL
To develop proficiency in SQL, I have completed several SQL challenges on HackerRank.

My solutions: https://github.com/dkeitley/sql-hackerrank.
Technologies used: SQL.
Interactive data visualisations
This is a working project using theee.js and D3.js to visualise the similarity between early rabbit and mouse development.
Here, each point represents a small cluster of cells (called neighbourhoods) sampled from rabbit and mouse embryos during development. They are positioned according to a 3-dimensional UMAP plot2, where neighbourhoods positioned closely together have similar gene expression. Known populations of cells (or cell types) are coloured. For instance, the red neighbourhoods represent erythrocytes, or red blood cells.
By hovering over/clicking each point, the top 5 most similar neighbourhoods in the other species are highlighted. The colour of the lines connecting the neighbourhoods represent the maximum correlation in gene expression between the neighbourhoods. Using OrbitalControls in three.js, a user can move around and zoom in to determine exactly which neighbourhoods are mapping and how they are positioned within the UMAPs.
Work is ongoing to display information about each neighbourhood, show colour legends and integrate the visualisation into a htmlwidget.
The Github repository can be found here.
Technologies used: JavaScript, D3.js, three.js.
Machine Learning
As part of an Applied Deep Learning Master’s course, at the University of Bristol, I implemented a convolutional neural network to recognise street sign images. The Tensorflow implementation was based on an architecture used by Zhang et al (Zhang et al. 2017) and achieved 96.7% accuracy on the German Traffic Sign Recognition Benchmark (GTRSB). The model incorporates several deep learning techniques including data augmentation, dropout and Adam optimisation.
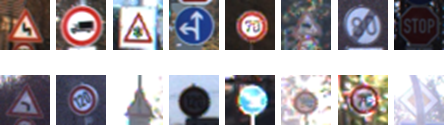
Figure 4: Example images from the GTRSB dataset.
Github repository: https://github.com/dkeitley/traffic-sign-recognition.
Technologies used: Python, Tensorflow.
To get a sense of how UMAP plots work, I recommend visiting the UMAP zoo (https://duhaime.s3.amazonaws.com/apps/umap-zoo/index.html) and reading the Google PAIR blog post at https://pair-code.github.io/understanding-umap/↩︎